Population Density Russia: Facts and Analysis
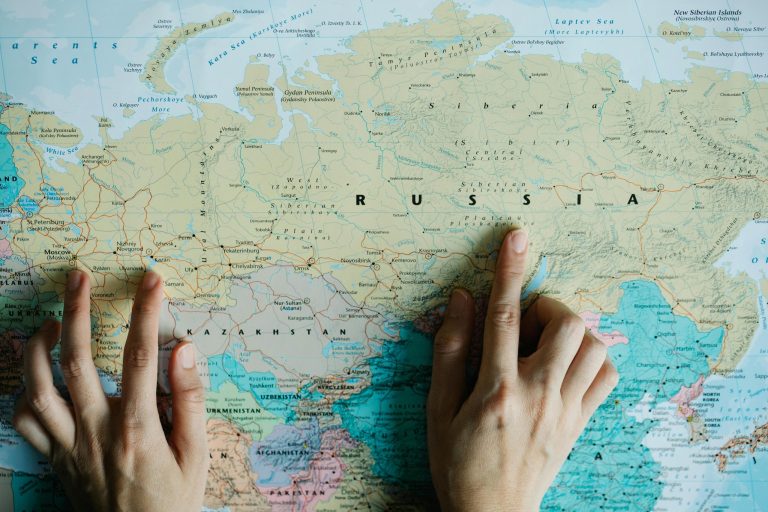
Russia covers 17,075,400 square kilometers, yet its average density is only 8.5 people per square kilometer. This translates to 22 per square mile. The numbers hide stark contrasts that a Russian population map reveals. Most people reside west of the Urals, while vast areas in Siberia and the Far East are sparsely populated.
As of January 2025, Russia’s population is estimated at 146,028,325, a decrease from 147.2M in the 2021 census. The United Nations ranks Russia ninth in population globally. About three-quarters of its people live in cities. This disparity raises the question of how such a vast land supports uneven settlement.
Demography plays a critical role. Rosstat reports a natural decline of about 596,200 people in 2024, marking a year-over-year increase in losses. In 2023, life expectancy was 73 years, with men living to 68 and women to 79. The fertility rate of 1.41 in 2024 is below replacement level, affecting long-term population distribution and regional labor markets.
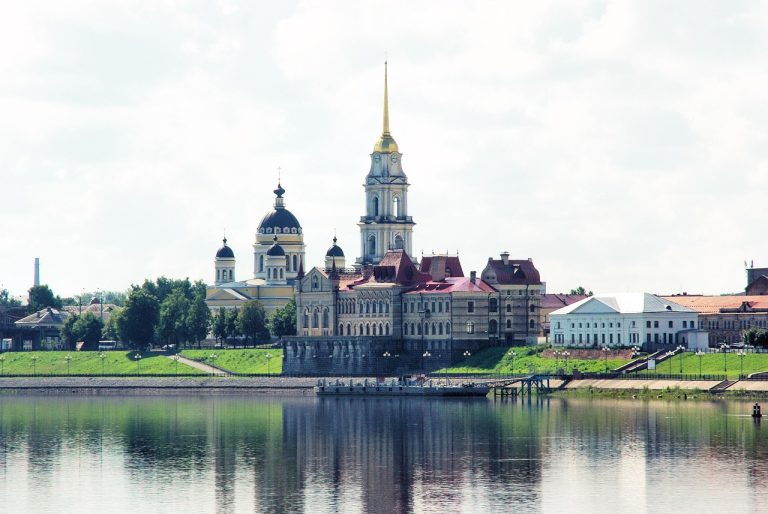
The context is essential for those studying a Russian population map. Moscow and St. Petersburg are hubs of dense urban areas in European Russia. In contrast, the harsh climate, permafrost, and distance limit permanent settlements to the east.
Russia at a Glance: Size, Population, and Density Context
Russia’s vast size dominates discussions on population density. It spans both Europe and Asia, with varied climates and landscapes. This diversity influences where people settle, making it essential to consider both size and actual population distribution on any Russian population map.
Russia in One Glance (2025)
Population
146,028,325
As of Jan 1, 2025 (Rosstat)
Average Density
~8.5/km² (≈22/mi²)
National average
Urban Share
≈74–75% (~108M)
City-dwellers as share of total
Life Expectancy (2023)
~73 (♂ ~68 / ♀ ~79)
Rounded national averages
Fertility (2024)
~1.41 TFR
Births per woman
Natural Decrease (2024)
~–596,000
Births minus deaths
Figures shown above use the most recent official releases available at the time of publishing. Some indicators are reported with a 1–2 year lag and may be revised by statistical agencies.
Total Area and Scale Across Europe and Asia
Russia’s landmass stretches over 17,075,400 square kilometers, crossing 11 time zones. It spans approximately 5,600 miles east to west and 1,500–2,500 miles north to south. The country is home to the Volga, Lake Ladoga, and Lake Baikal, which are key to understanding population distribution along waterways.
Current Population Estimates and Global Rank
Recent estimates suggest a population between 144.8M and 146.0M. Rosstat reported 146.0M in January 2025, while Britannica estimates 145.3M for 2025. The UN/Worldometer figure for 2024 is 144.8M. Russia ranks ninth globally by population, influencing how its population map is viewed internationally.
Average Density vs. Continental Comparisons
The average density is near 8.5 people per square kilometer, with a UN estimate of 9. Despite being Europe’s most populous country, Russia’s density is lower than Western Europe’s. This gap highlights the vastness of Russia’s territory, where many people live in relatively sparse areas.
Why Vast Territory Masks Local Crowding Patterns
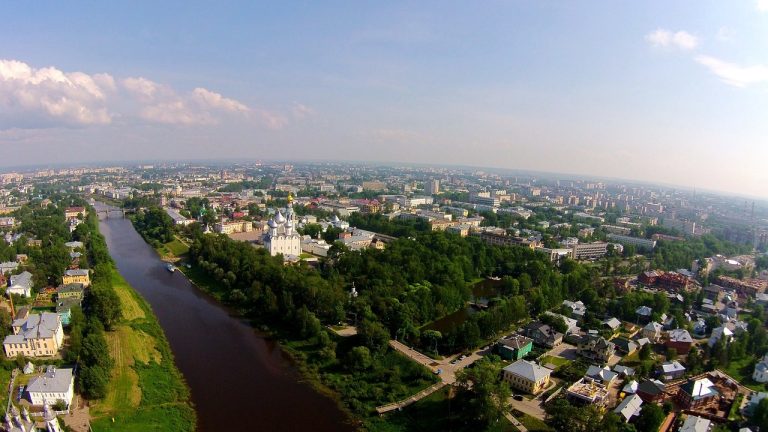
Most residents reside in European Russia, mainly along the Moscow–St. Petersburg axis and river corridors like the Volga and Don. Siberia and the Far East, with their permafrost, raise costs and slow development. These areas have dense urban clusters amidst vast expanses, defining Russia’s population distribution on any map.
Russia’s Population Density Today: Headline Numbers and Trends
The latest figures reveal how population density in Russia influences daily life and policy. Despite its vast land area, the national average remains low. In contrast, Urban Density in Russia is concentrated in specific regions. The demographic patterns show a stable land size but a shifting population count.
Average Density: About 8.5 People Per Km² (22 Per Sq Mi)
Rosstat and UN sources indicate a national average of 8.5 people per km², or 22 per square mile. Some global datasets estimate this number to be around 9 people per km² by 2025. This baseline is essential for comparing Urban Density in Russia with its sparsely populated interior.
Population Change: Decline From 2021 and 2024–2025 Snapshot
Population has edged down since 2021 (147.2M census) to 146.0M on Jan 1, 2025 (Rosstat). The decline reflects natural decrease (fewer births than deaths) with migration cushioning but not reversing losses. This decrease is attributed to excess COVID-19 mortality in 2020–2021.
Urban Share Near Three-Quarters of Population
Approximately 74–75% of residents reside in cities, totaling around 108M people in 2024–2025. This figure aligns with previous estimates, highlighting a persistent preference for metropolitan living. Such a trend reinforces Urban Density in Russia while keeping the national average low.
Natural Decrease, Migration Balance, and UN Outlook
Rosstat reported a natural decline of 596,200 in 2024, a significant increase from the previous year. Net migration has seen fluctuations, from a gain in 2022 to a negative balance by 2025.
UN projections suggest a decrease in population by 2030 and 2050. Despite this, population density in Russia is expected to remain between 8–9 people per km² as demographic patterns continue to evolve.
Russia Population Distribution: Where People Actually Live
The Russia population distribution is uneven, influenced by climate, terrain, and long trade routes. A Russian population map reveals dense clusters west of the Urals and sparse settlements across the vast east. Urban density in Russia reflects job opportunities, transport links, and the challenges of building in difficult zones.
European Russia Concentration vs. Asian Russia Sparsity
Most residents reside on the East European Plain, where fertile soils, rivers, and lower elevations support agriculture and infrastructure. This region, stretching from the Baltic to the Volga, shows significantly higher population densities on any Russian population map.
East of the Urals, settlement density drops dramatically across the taiga, tundra, and vast distances between towns. Despite its vast resources, Asian Russia has fewer people, leading to low urban density outside key locations.
Moscow and St. Petersburg as Dominant Urban Poles
Moscow, the capital, is a hub for finance, technology, and federal administration. St. Petersburg adds to this with its ports, shipbuilding, and cultural significance, forming a northern axis.
These cities attract migrants with better wages and services. Their influence increases metropolitan urban density in Russia and shapes the population distribution beyond city limits.
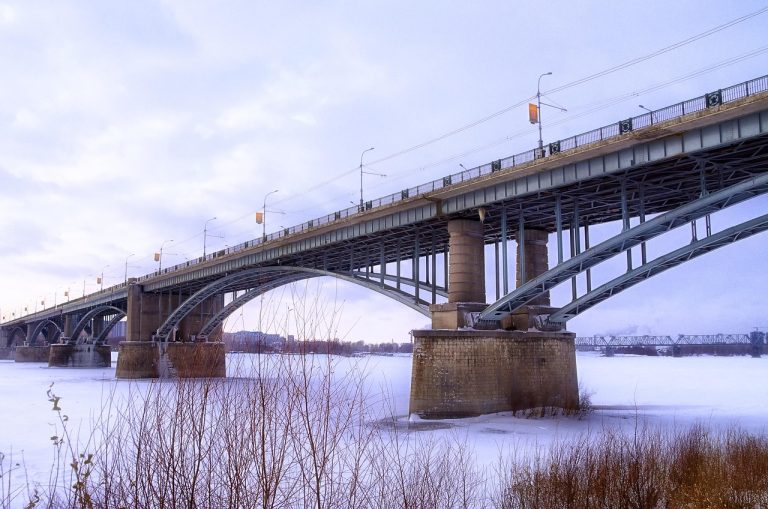
Industrial Belts and River Corridors (Volga, Don)
The Volga corridor connects Nizhny Novgorod, Kazan, Samara, and Volgograd, forming a chain of factories, refineries, and logistics hubs. Along the Don, Rostov-on-Don connects to the North Caucasus and the Sea of Azov.
Historic trade on navigable waterways guides settlement patterns. A Russian population map shows these belts as continuous, vibrant bands.
Permafrost, Climate, and Terrain Limiting Settlement
Permafrost covers millions of square kilometers, complicating construction, roads, and pipelines. Severe winters increase heating and maintenance costs in northern latitudes.
Marshlands in the West Siberian Plain and mountain ranges in the south and east limit large town development. This results in sparse settlements and low Urban Density in Russia away from resource sites.
Most Populated Regions in Russia and Major Cities Shaping Density
Russia’s largest cities are the heart of where people live and work, influencing national averages. The most populated regions are in the European core, where the road and rail grid connects urban hubs. This pattern increases urban density in Russia, from the northwest to the Volga and the Urals.
Moscow stands at the center, with over 10 million people in the city and several million more in the metro area. Saint Petersburg, with more than 5 million, is the second major hub. Their strong labor markets, transit links, and public services draw migrants from smaller cities and rural areas.
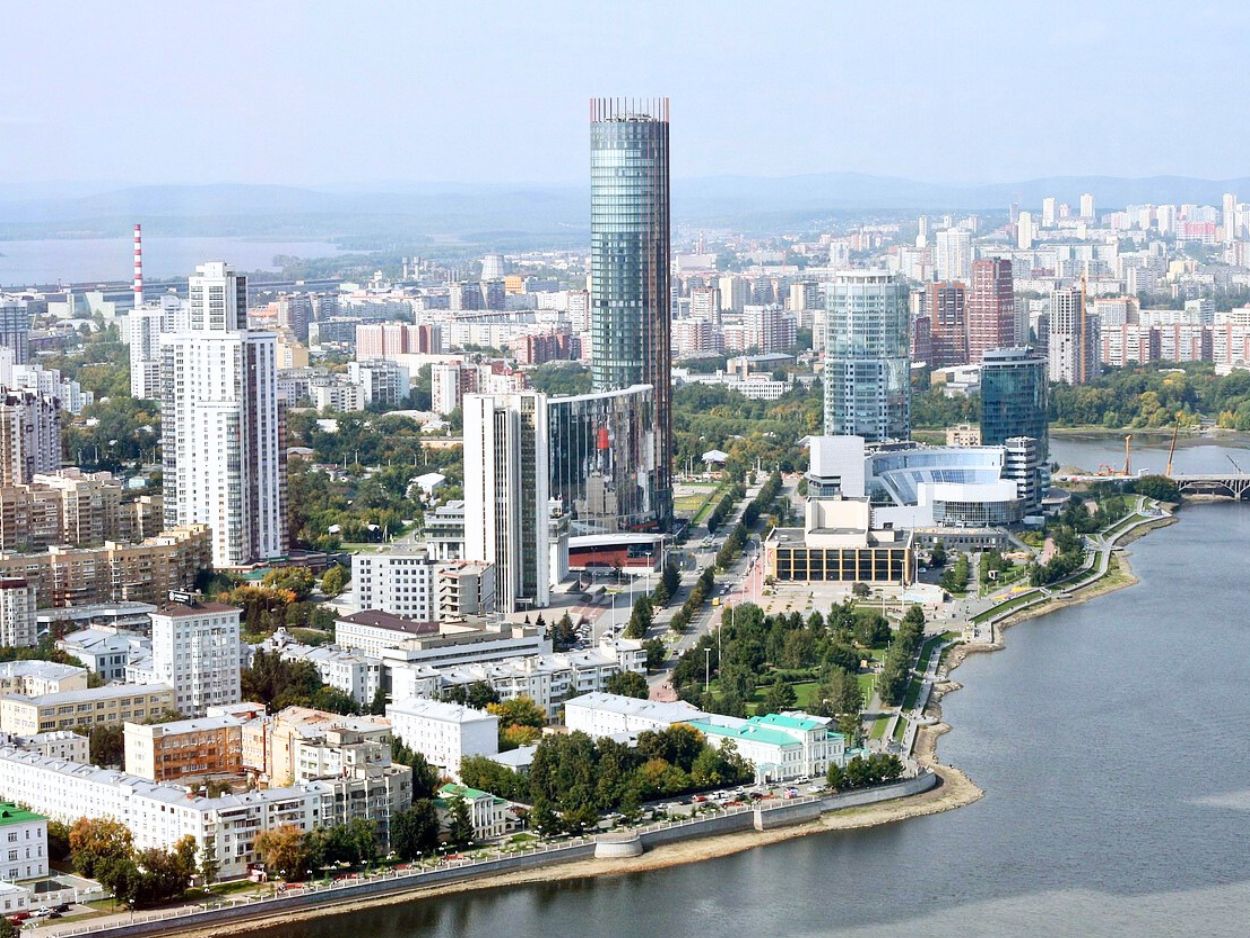
Beyond the capitals, cities with over a million people act as regional anchors. Novosibirsk, Yekaterinburg, Nizhniy Novgorod, Kazan, Chelyabinsk, Omsk, Samara, and Rostov-na-Donu form dense corridors along the Volga and across the Urals. Ufa, Krasnoyarsk, Voronezh, Volgograd, and Perm extend this network, though the surrounding land keeps averages low outside city limits.
Coastal and exclave hubs add unique nodes. Kaliningrad boosts density in the Baltic pocket. In the Far East, Vladivostok and Khabarovsk concentrate people and services on the Pacific rim. These centers form islands of intensity within vast, thinly settled territories, a hallmark of Urban Density Russia outside the European heartland.
| City | Pop. (approx.) | Note |
| Moscow | ~13.3M | National hub; densest metro pull |
| St Petersburg | ~5.65M | Northwestern pole |
| Novosibirsk | ~1.61M | Siberian hub |
| Yekaterinburg | ~1.50M | Urals anchor |
| Kazan | ~1.24M | Tech/education center |
These concentrations mark the most populated regions in Russia, with metropolitan pull strongest in the European core and selective nodes across Siberia and the Far East. Together they define how urban density Russia appears on the map, even as vast hinterlands keep overall averages modest.
Population Density Russia by Macro-Regions: European Core, Siberia, and the Far East
Population density in Russia varies greatly, influenced by terrain, transport, and climate. The European core is densely populated, contrasting with the sparse settlements in Siberia and the Far East. The layout of rail lines, ports, and rivers determines where people and jobs congregate.
European Core: Highest Densities and Contiguous Urban Network
The Russian Plain fosters dense settlements and short travel times. The Moscow–St. Petersburg axis connects a vast labor and housing market. The Volga corridor, with cities like Nizhny Novgorod, Kazan, Samara, and Volgograd, serves as a backbone for industry and services.
Linked rail and river networks form a chain of mid-sized cities. This network strengthens tax bases and universities, boosting the average population density in western oblasts.
Siberia Population Density: Low Averages With Nodal Cities (Novosibirsk, Krasnoyarsk, Irkutsk)
Siberia’s population density is low, except for a few key cities along the Trans-Siberian Railway. Novosibirsk, Krasnoyarsk, and Irkutsk are hubs for services, research, and logistics, situated on the Ob, Yenisei, and Angara rivers.
Permafrost, wetlands, and vast distances limit broad settlement. Most people live near rail junctions and river ports, leaving the taiga sparsely populated.
Russian Far East Demographics: Coastal Hubs (Vladivostok, Khabarovsk) Amid Vast Low-Density Areas
The Russian Far East’s demographics focus on maritime cities. Vladivostok and Khabarovsk, with their ports, shipbuilding, and trade with Northeast Asia, increase coastal density.
Inland, mountains and subarctic zones reduce community sizes. Supply chains stretch over thousands of miles, leaving many districts with only small settlements.
Resource Frontiers vs. Permanent Settlement Patterns
Hydrocarbons, metals, and timber open up frontiers in Siberia and the Pacific regions. Company towns and pipelines emerge quickly, stabilizing as projects mature.
Yet, harsh winters and distance limit family migration and long-term growth. As a result, Siberia and the Far East’s population density remains low, except in a few durable hubs.
| Macro-region | Pattern | Anchors |
| European core | High, contiguous belts | Moscow, St Petersburg; Volga corridor (Nizhny Novgorod, Kazan, Samara, Volgograd) |
| Siberia | Low averages; nodal clusters | Novosibirsk, Krasnoyarsk, Omsk, Irkutsk |
| Far East | Sparse inland; coastal pockets | Vladivostok, Khabarovsk, Yakutsk |
Urban Density Russia vs. Rural Settlement: Contrasts and Causes
Urban density in Russia shows stark contrasts across the map. City cores draw people and capital, while villages thin out. This creates a dense network of services in major hubs and a sparse one elsewhere.
Moscow Population Concentration and Metropolitan Pull
Moscow’s population concentration dominates national patterns. With over 10 million residents in the city and more in the Moscow Oblast, it centralizes federal administration, finance, and top universities. The proximity to St. Petersburg creates a corridor that attracts skilled labor and investment.
This metropolitan pull intensifies urban density by clustering high-value services like banking, media, and technology near decision-making centers. The jobs, transit links, and cultural assets in these cores set a pace few regional cities can match.
Rural vs Urban Russia: Aging, Services Access, and Employment
Rural vs Urban Russia shows diverging age profiles and opportunities. Life expectancy recovered to about 73 years in 2023 after a pandemic dip. Yet, sparsely populated districts face clinic closures, long commutes to schools, and thin labor markets. Abandoned villages reported by demographers mark years of outmigration.
Employment in the countryside leans toward public sector and resource work, while cities host diversified roles in logistics, IT, and creative industries. These gaps press young adults to move, concentrating services and further thinning rural rosters.
Internal Migration Toward Major Agglomerations
Internal migration channels flow toward Moscow, St. Petersburg, and regional centers like Kazan, Yekaterinburg, and Novosibirsk. Even as natural decrease resumed after 2016, metropolitan regions continued to gain residents. This reinforces urban density Russia and reshapes labor pools.
These moves are often stepwise: from village to district town, then to a regional capital. Each step improves access to hospitals, universities, and steady wages. This sustains the draw of large agglomerations.
Infrastructure and Climate Constraints on Rural Retention
Long distances, harsh winters, and permafrost complicate road, rail, and housing projects—east of the Urals. High costs limit frequent repairs and last-mile delivery, making year-round services harder to maintain.
These constraints narrow private-sector options outside urban cores. As logistics and heating bills rise, rural households face higher living costs and fewer choices. This tips the balance toward citybound moves, adding to Moscow’s population concentration within the broader rural vs urban Russia divide.
Russian Demographic Patterns Shaping Density: Births, Deaths, and Migration
Russian demographic patterns significantly influence where people reside and work, impacting population density across various regions. The dynamics of births, deaths, and migration play a critical role in balancing the population between urban centers and rural areas.
Low Fertility (Around 1.41–1.47) Below Replacement
Rosstat reports a total fertility rate near 1.41 in 2024, with UN estimates ranging from 1.45 to 1.47 in recent years. Birth rates have fluctuated, dropping after the Soviet era, increasing in the 2000s, and remaining below replacement levels. This trend affects the number of individuals entering schools and the workforce, impacting population density over time.
In regions lacking strong job opportunities, lower birth rates have a more pronounced effect. Urban areas, with their stronger job markets, absorb these changes, exacerbating the rural-urban divide.
Life Expectancy Recovery and Gaps by Sex
Life expectancy rebounded to about 73 years in 2023, following a pandemic-related drop to near 70 in 2021. The gap between men and women remains significant, with men living roughly 68 years and women 79. This disparity influences household structures and the age demographics of cities and towns.
As older residents become a larger portion of the population, it impacts health care spending and labor force participation. These factors steer internal migration patterns, influenced by Russian demographic trends.
Natural Decline in Population
Deaths have exceeded births in most years post-1992, with a brief respite in the mid-2010s. The pandemic exacerbated this trend, with natural decline peaking at nearly 997,000 between October 2020 and September 2021. In 2024, the natural decrease reached about 596,200, a significant increase from 2023.
This persistent decline reshapes the population map, with smaller towns experiencing a decline in density while large cities maintain their numbers. Such shifts alter population density in core corridors and leave sparse areas with limited services.
Net Migration’s Role Amid Labor and Brain Drain Pressures
Immigration has partially offset the population shortfall, though the balance is volatile. Estimates indicate a net inflow of roughly 765,629 in 2022, with a projected negative balance by 2025 near −251,822. Skilled departures, including many tech workers, add to the pressure, despite some returning.
UN scenarios forecast a smaller total population by mid-century, which would concentrate urban populations further. These projections deepen the contrasts between rural and urban Russia, highlighting the role of demographic patterns in shaping long-term density outcomes.
Conclusion
Population density in Russia averages about 8.5 people per square kilometer, revealing a stark contrast. The European core, with Moscow and St. Petersburg at its heart, stands in stark contrast to the vast, sparsely populated Siberia and the Far East. The country’s population has slightly decreased, with a 2024–2025 count showing a natural decline and mixed migration trends. These factors significantly influence Russia’s population distribution, more so than any single figure.
Urbanization is high, with nearly three-quarters of the population residing in cities, leading to their growth. Yet, rural areas face aging and decline. The challenges of long distances, harsh winters, and vast expanses of permafrost limit settlement to the core. Major cities like Nizhny Novgorod and Kazan in the west, and Novosibirsk, Krasnoyarsk, Irkutsk, Vladivostok, and Khabarovsk in the east, serve as hubs. These cities are “islands” in low-density areas, affecting service and job access.
Demographic trends are critical. Fertility rates are below replacement levels, and life expectancy gaps between sexes and a post-pandemic mortality peak are expected to continue. The UN projects further decline into the 2030s and beyond. Debates focus on city-led growth, selective immigration, and targeted infrastructure. The outcome will determine if population density in Russia becomes more concentrated or if it stabilizes through regional investment and migration incentives.
Currently, Russia’s population distribution mirrors a core-periphery model. The European heartland is densely populated, while the eastern resource frontiers are thinly settled. The most populated regions is likely to continue to attract workers and capital. Peripheral areas rely on logistics, energy projects, and public spending. Geography, climate, and demography will shape the future for the next generation.
FAQs
What is Russia’s Current Population And How Dense is it?
As of Jan 1, 2025, Russia’s population is 146,028,325 (Rosstat). The national average density is ~8.5 people per km² (≈22/mi²).
Where Do Most People in Russia Live?
Most people live in European Russia west of the Urals. Density is highest along the Moscow–St Petersburg axis, the Volga and Don corridors, and south toward Rostov-on-Don and the North Caucasus.
How Do River Corridors Affect Settlement Patterns?
Navigable rivers lowered historical transport costs and fostered industry. The Volga links cities like Nizhny Novgorod, Kazan, Samara, and Volgograd, while the Don connects Rostov-on-Don and the Azov-Black Sea gateway, creating continuous belts of higher density.
What Share Of Russians Live In Cities?
About 74–75% of residents live in urban areas—roughly 108 million people (2024 series). Internal migration continues to favor large agglomerations.
How Do Birth And Death Trends Affect Density?
Fertility is sub-replacement at ~1.41 (2024), and life expectancy is ~73 years (2023: men ~68; women ~79). Deaths have exceeded births in most recent years, driving natural population decline.
What Role Does Migration Play In Russia’s Demographics?
Migration cushioned losses but hasn’t reversed them. Net inflows surged in 2022 (+765k) and then weakened in 2023; recent totals vary by source and no longer offset natural decrease nationwide.
Why Do Rural Areas Continue To Lose People?
Rural vs Urban Russia dynamics reflect aging populations, fewer jobs, and limited services. Schools and clinics are harder to sustain across long distances, prompting outmigration toward cities with better access and employment.
How Do Resource Frontiers Influence Long-Term Settlement?
Extractive projects create company towns and logistics nodes in Siberia and the Far East. Yet harsh climate and remoteness limit family settlement, so these hubs rarely shift regional averages in a lasting way.
Similar Posts
What Major River Runs Through Russia – The Volga
The Volga River is the clear answer to what major river runs through Russia. It is Europe’s longest river and the country’s national river. Flowing from the Valdai Hills in Tver Oblast to the Caspian Sea in Astrakhan Oblast, it is entirely within the Russian Federation. The river stretches about 3,531 km (2,194 miles), dropping…
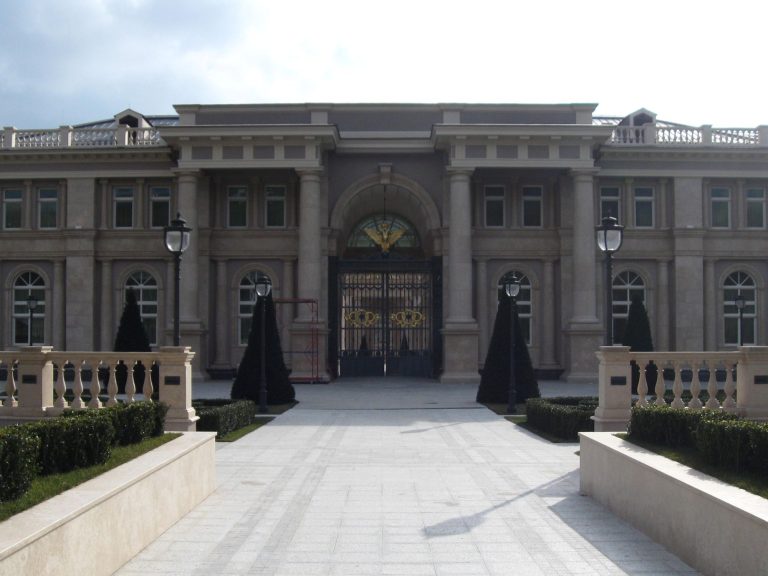
Putin Black Sea Mansion: Inside the Luxury Palace
A huge complex near Gelendzhik has caught the world’s eye. The Italianate estate spans 190,420 square feet and cost over $1 billion. It’s linked to Russia’s president, causing protests and global interest. The mansion is at Cape Idokopas on the Krasnodar Krai coast. It has a theater, casino, ice rink, and wine cellar. Alexei Navalny’s…
Current Season in Russia: Climate Insights
When you ask what season it is in Russia, the answer varies. St. Petersburg has a marine climate, with cool, damp winds. Yakutsk, in Siberia, has a harsh continental climate, with sudden temperature changes. Russia covers eleven time zones, so seasons change differently across the country. In one week, you might see sleet near the…
Is Russia a Good Place To Live in 2025?
Living in Russia is a mixed bag. The country has the world’s fourth-largest economy by some measures. Yet, it ranks 45th in per capita income. Economic sanctions, 4.8% inflation, and currency swings add to the uncertainty. The quality of life in Russia changes a lot depending on where you are. People get free healthcare and…
Tallest Mountain in Russia: Mount Elbrus
Snow and sky draw a clean line on Mount Elbrus, a dormant giant rising to 5,642 m (18,510 ft). It’s the tallest mountain in Russia and often called the highest in Europe. The twin domes create a broad skyline, with the western summit slightly higher than the eastern. Elbrus is on the border of Kabardino-Balkaria…
Neighboring Countries That Border Russia
Russia is a huge country in northern Eurasia, covering about 17,075,400 square kilometers. It goes from the Arctic tundra to the Pacific and touches mountains in the south. This vast area affects trade, security, and culture in countries around it. Russia shares borders with 14 countries from the northwest to the southeast. These include Norway,…