
Russia’s latest inflation data from the Federal State Statistics Service reveal a slight easing to 8.0% in September 2025. This marks a decrease from 8.1% in August, the softest pace seen in over a year. Core inflation slowed to 7.7% year over year, while monthly Russia CPI rose 0.34% after a 0.40% decline in August. Despite the Bank of Russia’s 4% target, price growth remains high, highlighting ongoing challenges to the Russian cost of living.
Category data show mixed trends. Food prices rose 9.5% year over year, easing from 9.8% in August. Non-food goods remained steady at 3.9%, and services stayed elevated at 11.1%. These indicators suggest ongoing demand and supply frictions, even as headline inflation cools.
The current cycle is set against a backdrop of significant inflation history. From 1991 to 2025, inflation averaged 99.64%, peaking at 2,333.30% in December 1992 and hitting a low of 2.18% in February 2018. In 2023, inflation averaged 5.9%, rising to about 8.5% in 2024 due to increased spending and labor shortages. In April 2025, headline inflation reached 10.2% year over year, with services at 12.9%, food at 12.7%, and non-food at 9.3%.
Looking ahead, models suggest a gradual cooldown. By the end of the current quarter, inflation is expected to drop to 6.80%. It is forecasted to trend toward 4.70% in 2026 and 4.20% in 2027. For those tracking the Russia CPI and the broader cost of living, the data indicate a slowdown but not yet a return to target. Sanctions-era supply constraints and tight labor markets continue to influence the path, fueling debate over inflation trends in Russia.
Latest Russia CPI, Core Inflation, and Economic Indicators
Investors and policymakers closely monitor the Russia consumer price index to understand price movements in goods and services. Recent data shows a slowdown from peak levels, yet inflation remains significantly above the target. Each release is scrutinized for insights into the Russian inflation rate, interest rate trajectory, and ruble performance, influenced by trade and fiscal policies.
Why the Russia Consumer Price Index Matters for Markets and Policy
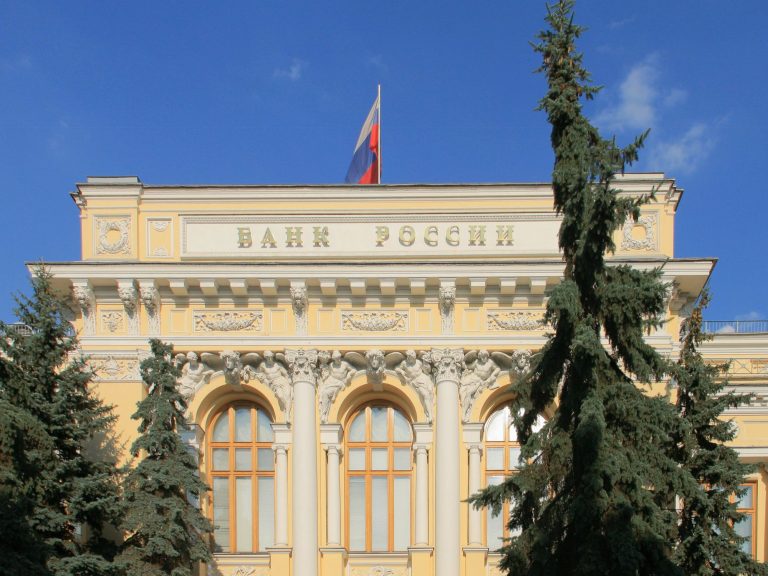
The Bank of Russia sets its 4% target based on the Russia CPI, influencing the key rate, now at 21.00% per annum. This benchmark affects borrowing costs, the OFZ curve, and corporate funding. It also guides wage negotiations, tariff adjustments, and social payments.
- Bond yields: CPI shifts feed into breakevens and real rates.
- FX dynamics: the ruble’s path reflects inflation risk and trade flows.
- Household budgets: price growth affects savings, credit, and consumption.
Russian economic data also influences the Putin economic impact on spending and labor markets. High inflation readings can indicate supply issues and fiscal spending, affecting the Russian inflation rate and corporate pricing power.
September 2025 Headline at 8% YoY, Core at 7.7%
Headline inflation was 8.0% year over year in September 2025, a slight decrease from August’s 8.1%. Core inflation was 7.7%, showing underlying pressures remained strong. Month over month, CPI rose 0.34% after a 0.40% drop in August, indicating a re-acceleration into autumn.
| Indicator | September 2025 | August 2025 | Policy/Context |
|---|---|---|---|
| Headline Russia CPI (YoY) | 8.0% | 8.1% | Target 4% guides policy stance |
| Core Inflation (YoY) | 7.7% | 7.8% | Signals underlying price trend |
| CPI (MoM) | +0.34% | -0.40% | Seasonal and pass-through effects |
| Services Inflation (YoY) | 11.1% | — | Labor and capacity constraints |
| Food Inflation (YoY) | 9.5% | — | High sensitivity due to basket weight |
| Non-Food Inflation (YoY) | 3.9% | — | Softer demand and import mix |
| Key Rate | 21.00% | 21.00% | Bank of Russia tightening bias |
These readings are above the 2023 baseline and reflect 2024’s elevated average, influenced by fiscal expansion and tight labor supply. As new Russian economic data emerges, desks will reassess short-term paths, expecting inflation near 6.8% by quarter-end and medium-term paths closer to target.
The Russian inflation rate remains the key indicator for policy and markets, with ongoing pass-through risks. The Russia consumer price index provides the most direct gauge of pressure points across the basket and the broader Putin economic impact narrative.
Russian Inflation Rate in September 2025: What the Latest Reading Shows
Rosstat’s latest data shows a slight decrease in price growth. The Russia CPI has eased, while services remain steady. This keeps the cost of living in Russia higher than before the shock. The economic indicators in Russia show a slower pace than in spring. Yet, the Russian ruble inflation continues to influence retail prices and wages.
Headline Inflation Eased to 8% YoY From 8.1% in August
The headline Russian inflation rate dropped to 8.0% year over year in September. This is down from 8.1% in August. It marks the lowest reading in over a year, following a period of higher inflation. For households, the trend suggests slower but persistent price pressure.
Core Inflation Slowed to 7.7% YoY; Monthly CPI Rose 0.34%
Core inflation cooled to 7.7% from 8.0%, showing a decrease beyond volatile items. On a monthly basis, CPI rose 0.34% after a 0.40% drop in August. This shift aligns with broader economic indicators in Russia, where upstream costs and Russian ruble inflation continue to affect retail prices.
Food 9.5%, Non-Food 3.9%, Services 11.1%
Food inflation slowed to 9.5% from 9.8%, while non-food goods remained at 3.9%. Services rose 11.1%, maintaining pressure on the Russian cost of living. Earlier in 2025, food and services led gains. Producer prices in March increased 5.9% year over year, indicating prior pipeline pressures within the Russia CPI basket.
Central Bank 4% Target vs. Current Reality
The gap with the Bank of Russia’s 4% goal remains significant. Price growth has cooled from April’s 10.2% year over year, but inflation is about double the target. This mix of slower headline readings and firm services shapes current economic indicators in Russia. It frames the debate over Russian ruble inflation and the Russian cost of living.
Drivers and Pressures: Bank of Russia Monetary Policy, Ruble Dynamics, and Fiscal Forces
Russia’s price setting is influenced by tight credit, a volatile exchange rate, and large public outlays. Recent economic data reveal firm demand despite high lending costs. This shapes inflation trends in Russia across goods and services.
Policy Stance: Key Rate at 21.00% and Tight Guidance
The Central Bank of Russia maintains the key rate at 21.00% per year to control demand and stabilize expectations. This policy, a core part of the Bank of Russia’s monetary strategy, has seen aggressive hikes starting in 2024. The guidance indicates a cautious approach, aiming to manage ongoing pressures in the latest Russian economic data.
Officials highlight pro-inflation risks from the budget and supply chain issues. The tight policy restricts credit growth and delays investments. Yet, services prices remain firm, pushing inflation trends in Russia above the target.
Ruble Pass-Through and Imported Inflation Risks
Fluctuations in the exchange rate impact import prices and intermediate goods. A weaker ruble increases costs for retailers and producers, leading to higher prices on shelves. This deepens Russian ruble inflation.
Volatility from oil prices and geopolitics increases the risk of imported inflation. These factors, evident in Russian economic data, can counteract disinflation from soft demand. They pressure tradable goods and technology-intensive categories.
Government Spending, Labor Shortages, and Wage Growth
Fiscal policy is expansive, with significant spending on defense and social transfers. This boost to household income supports consumption, even with high interest rates. It shapes inflation trends in Russia across different regions and sectors.
The labor market is tight due to mobilization and emigration, driving up wages. Faster wage growth, combined with limited capacity, increases services costs. This contributes to the observed Russian ruble inflation in recent months and the broader Putin economic impact on domestic demand.
Global Commodity Prices and Sanctions-Related Supply Constraints
Global food, energy, and shipping prices add volatility to input costs. Sanctions, in place from 2014 and intensified post-2022, have rerouted trade and raised compliance costs. This limits access to parts and technology.
These issues are reflected in Russian economic data through higher non-food prices and longer delivery times. Alongside commodity price swings, they reinforce cost-push forces. This keeps the Bank of Russia’s monetary policy stance focused on restraint, as inflation trends in Russia adjust to supply limits.
From 1990s Hyperinflation to Today’s CPI Basket
Russia’s economic journey has been marked by both turmoil and stability. The Russia CPI reflects these changes, showing how living costs adjust to policy shifts and supply issues. It is a key indicator for households and businesses, influencing their planning and financial decisions.
The inflation rate in Russia once skyrocketed, drastically altering daily life. Later, stricter rules and tighter budgets helped stabilize it. Today, prices in food, services, and transport continue to influence the CPI, making it essential for understanding living costs and business margins.
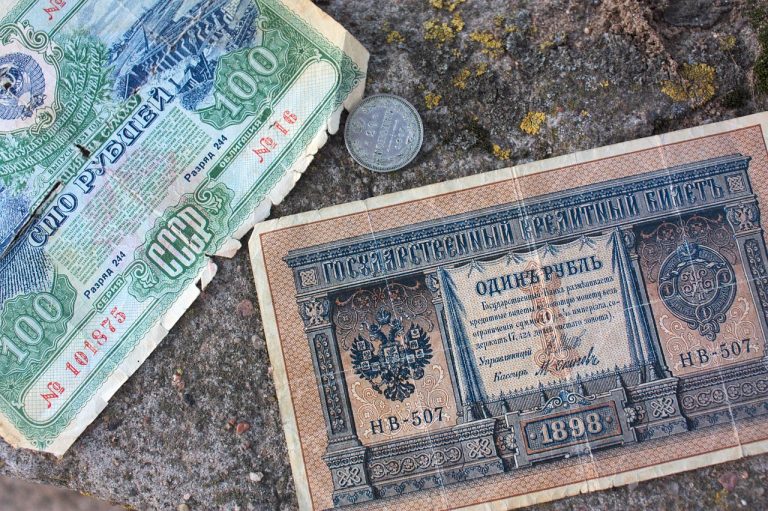
Long-Run Volatility: Peak 2,333.3% (Dec 1992) to Low 2.18% (Feb 2018)
Price liberalization in the early 1990s led to a peak inflation rate of 2,333.3% in December 1992. Disinflation then began, with the rate dropping to 84.4% in 1999 following a financial crisis. The rate continued to decline through the 2000s, reaching a record low of 2.18% in February 2018. This progress highlights the significant strides made in stabilizing the Russian economy.
Despite these advances, external shocks have disrupted the trend. The 2014–2015 sanctions and ruble depreciation increased prices. In April 2022, inflation surged to 17.8% year over year. These fluctuations are deeply ingrained in Russian economic data, influencing risk assessments.
Recent Path: 2024 Average ~8.5% vs. 5.9% in 2023; April 2025 at 10.2% YoY
In 2024, inflation averaged about 8.5%, up from 5.9% in 2023. Fiscal expansion and supply constraints drove the increase. By April 2025, headline inflation reached 10.2% year over year, with services and food costs rising again.
These inflation rates are critical in shaping discussions on borrowing costs and wages. They also set the stage for expectations on the cost of living, as households face quicker price increases in key categories.
CPI Weights: Food & Non-Alcoholic Beverages 30%, Transport 14%, Clothing & Footwear 11%
The CPI basket focuses on essential items influenced by global and domestic factors. Food and non-alcoholic beverages account for 30%, transport for 14%, and clothing and footwear for 11%. Housing, water, electricity, gas, and other fuels make up 11%, while recreation and culture, and alcoholic beverages and tobacco each account for 6%.
Household appliances are 6%, and health, communication, education, restaurants and hotels, and miscellaneous goods and services together account for 16%. This composition explains why the Russia CPI is sensitive to energy, logistics, and crop cycles, as reflected in Russian economic data.
| CPI Component | Weight (%) | Key Price Drivers | Sensitivity to Ruble |
|---|---|---|---|
| Food & Non-Alcoholic Beverages | 30 | Harvests, imports, logistics | High |
| Transport | 14 | Fuel costs, parts, fares | High |
| Clothing & Footwear | 11 | Imported apparel, retail margins | Medium-High |
| Housing, Utilities, and Fuels | 11 | Administered tariffs, energy | Medium |
| Recreation & Culture | 6 | Electronics, leisure services | Medium |
| Alcoholic Beverages & Tobacco | 6 | Excise taxes, distribution | Low-Medium |
| Household Appliances | 6 | Imported goods, chips | High |
| Health, Communication, Education, Restaurants & Hotels, Misc. | 16 | Services wages, rents, inputs | Medium |
Services Inflation Outpacing Goods: 12.9% YoY in April vs. Non-Food 9.3%
In April 2025, services inflation hit 12.9% year over year, outpacing non-food goods at 9.3% and nearing food at 12.7%. Wage growth, tight labor markets, and regulated fees supported this gap. This pattern kept core measures close to headline in the Russia CPI.
This services-driven inflation helps explain the rising cost of living in urban areas and the resilience of the Russian inflation rate. It is a key aspect of understanding the current economic landscape in Russia.
Inflation Trends in Russia Through 2027
Forecasts suggest a gradual decline in inflation after September, with rates remaining above the target. Models and surveys track various indicators, including wages and currency, to predict a slow decline under Bank of Russia’s monetary policy. The immediate future hinges on maintaining exchange-rate stability and easing Russian ruble inflation pressures.
Short-Term Models: 6.8% Expected by End of the Current Quarter
Global macro models and analyst estimates forecast a 6.8% rate by quarter-end. This projection relies on firm monetary policy, steady supply chains, and a stable ruble. It also considers the current 8.0% headline and 7.7% core inflation rates, indicating a slowdown in monthly CPI increases in Russia.
Short-term risks include imported costs and logistics challenges. A weakening ruble could increase tradable prices, slowing down disinflation. This could keep the Russian inflation rate high, even as demand decreases due to tighter credit.
Medium Term: 4.7% in 2026 and 4.2% in 2027 (Model Projections)
Model projections indicate a gradual decrease in inflation, reaching 4.7% in 2026 and 4.2% in 2027. These figures reflect easing supply issues and a firmer monetary policy stance from the Bank of Russia. The path will remain close to, but not at, the 4% target.
Monitoring upstream costs is essential. A recent increase in producer prices, such as the 5.9% year-over-year PPI in March 2025, needs to be watched for its impact on Russia CPI over time.
Consensus Perspectives and Forecast Dispersion
Consensus services, including FocusEconomics, compile forecasts from a wide range of experts. The average shows a gradual decrease in inflation, yet there is significant variation due to currency fluctuations and fiscal policies. Some banks predict stronger demand, while others highlight external shocks and supply bottlenecks.
This range of forecasts reflects the uncertainty over the Russian inflation rate and when relief will come. It also shows how Russian ruble inflation can affect outcomes, influenced by external funding and import channels.
Risks to the Outlook: Geopolitics, Inflation Expectations, and Policy Trade-Offs
- Geopolitics and sanctions: New measures could disrupt imports, raise logistics costs, and pressure the ruble.
- Inflation expectations: If expectations stay high, disinflation slows despite a 21.00% key rate.
- Fiscal stance: Elevated spending can sustain demand against tight supply, delaying cooling in Russia CPI.
- Policy trade-offs: Keeping rates high may re-anchor prices but weigh on investment and real incomes.
| Horizon | Projected Rate | Key Drivers | Upside Risks | Downside Risks |
|---|---|---|---|---|
| End of Current Quarter | 6.8% | Tight Bank of Russia monetary policy, stable imports, softening demand | Ruble weakness, higher freight and insurance costs | Faster currency stabilization, quicker goods disinflation |
| 2026 | 4.7% | Moderating wages, easing supply constraints, anchored expectations | Fiscal stimulus, persistent Russian ruble inflation | Stronger output gap, lower commodity prices |
| 2027 | 4.2% | Extended policy restraint, improved trade routing, competitive pricing | Geopolitical escalation, sanctions tightening | Productivity gains, benign global inflation |
Baseline projections align with recent moderation and assume consistent policy execution. The Russian inflation rate path depends on currency stability, disciplined budgets, and the convergence of expectations toward the target.
Conclusion
September’s Russia CPI data showed a sixth consecutive month of inflation easing, with a rate of 8.0% year over year and core inflation at 7.7%. The monthly increase of 0.34% indicates a slowdown in momentum. Despite this, the gap to the Bank of Russia’s 4% target remains significant. Food prices cooled to 9.5%, non-food prices remained steady at 3.9%, and services prices stayed high at 11.1%. This highlights the persistent challenges in labor-intensive sectors and regulated tariffs.
The CPI basket’s structure magnifies external shocks, making global commodity price fluctuations and import issues more impactful. Sanctions, fiscal demand, and tight labor markets contribute to sustained cost pressures. Despite a 21.00% key rate aimed at slowing demand and stabilizing expectations, costs remain elevated.
The current inflation cycle in Russia is marked by significant volatility. From the 1990s hyperinflation to the recent spike, inflation trends have been unpredictable. Models predict a decline to 6.8% by quarter-end, followed by 4.7% in 2026 and 4.2% in 2027, assuming consistent policy and stable external conditions. Yet, geopolitical tensions, the ruble’s performance, and budget policy can alter this forecast.
For those following the Russian cost of living and market trends, the data suggests a gradual easing of inflation. The trend is positive, but the current levels are concerning. Keeping a close eye on Russia CPI, wage growth, and import prices will be essential. This will help determine if the progress continues without harming economic growth or household well-being.
FAQ
What Is Russia’s Current Inflation Rate and How Did It Change in September 2025?
Russia’s inflation rate eased to 8.0% in September 2025, down from 8.1% in August. This marks the lowest rate seen in April 2024, according to Rosstat. Core inflation also slowed to 7.7% year over year. The monthly CPI increase was 0.34%, following a 0.40% decline in August.
How Does the Current Inflation Compare With the Bank of Russia’s 4% Target?
The current inflation rate of 8.0% is double the Bank of Russia’s 4% target. This highlights ongoing price pressures. The key rate remains at 21.00% per annum, aiming to curb demand and stabilize inflation expectations.
Which Categories Drove September’s Inflation—Food, Non-Food, or Services?
Food inflation slowed to 9.5% year over year from 9.8% in August. Non-food goods remained steady at 3.9%. Services inflation, at 11.1%, shows sustained price growth in labor-intensive sectors.
Why Is the Russia Consumer Price Index Central to Markets and Policy?
The Russia consumer price index is key to the Bank of Russia’s inflation-targeting regime at 4%. It guides key rate decisions. CPI influences Russian bond yields, the ruble’s value, wage talks, and indexation of tariffs and social payments.
What Role Do Ruble Movements Play in Russian Inflation?
Ruble volatility impacts imported inflation through foreign goods and intermediate inputs costs. Shifts due to oil prices, sanctions, and geopolitics amplify pass-through effects. This affects the Russia CPI and the Russian ruble’s inflation profile.
How Do Fiscal Policy and the Labor Market Influence Prices?
Elevated government spending, including defense and social programs, supports demand. A tight labor market, influenced by mobilization and emigration, pushes wages higher. This contributes to services inflation and keeps core inflation elevated.
What Is the Historical Context for Inflation Trends in Russia?
Russia’s inflation averaged 99.64% from 1991 to 2025. It peaked at 2,333.30% in December 1992 and hit a record low of 2.18% in February 2018. Episodes like the 1998 crisis and post-2014 sanctions fueled spikes, while recent years saw renewed volatility.
How Is the CPI Basket Structured and Why Does It Matter?
The basket includes food and non-alcoholic beverages (30%) and transport (14%). Significant weights are also in clothing and footwear, housing and utilities, and recreation. This composition makes inflation trends in Russia highly sensitive to food and transport costs.
What Are the Latest Projections for the Russian Inflation Rate?
Trading Economics models predict inflation at 6.80% by the end of the current quarter. It is expected to trend toward 4.70% in 2026 and 4.20% in 2027. These projections assume tight monetary policy and some easing of supply frictions.
What Risks Could Derail Disinflation?
Key risks include renewed geopolitical tensions, additional sanctions, and ruble weakness that raise import costs. Elevated inflation expectations and high budget spending could slow disinflation, even with a 21.00% key rate.
How Did 2024 and Early 2025 Set the Stage for Today’s Readings?
Average inflation climbed to roughly 8.5% in 2024 from 5.9% in 2023 amid fiscal expansion and labor shortages. In April 2025, headline inflation hit 10.2% year over year, with services at 12.9% and food at 12.7%.
What Does the Producer Price Index Signal?
The producer price index rose 5.9% year over year in March 2025. This points to cost-push pressures that can pass through to consumer prices, affecting non-food goods and energy-intensive sectors.
How Does the Bank of Russia’s Monetary Policy Affect the Economy?
A 21.00% policy rate cools demand, supports the ruble, and helps re-anchor expectations. The trade-off is slower investment and pressure on real incomes, a central challenge for Bank of Russia monetary policy.
What Is the Link Between Inflation and the Russian Cost of Living?
High inflation erodes purchasing power, affecting food and services where weights are large. Indexation of pensions and tariffs offsets part of the hit, but sustained price growth keeps the Russian cost of living elevated.
How Do Markets React to Russia CPI Prints?
Softer CPI readings can lower bond yields and support the ruble if they signal policy relief ahead. Stickier inflation keeps yields high and pressures the currency, influencing capital flows and asset prices in Russian economic data.
What Are Consensus Views on the Path Back to Target?
Consensus services such as FocusEconomics show dispersion around the disinflation path due to uncertainty over fiscal stance, sanctions durability, and exchange-rate dynamics. Baselines point to gradual easing, not a quick return to 4%.
How Do Food and Transport Costs Influence Inflation Trends in Russia?
With food at 30% and transport at 14% of the basket, commodity prices, logistics, and supply-chain frictions have outsized impact. This helps explain persistent food inflation and the sensitivity of Russia CPI to global shocks.
What Is “Core Inflation” and Why Is It Important?
Core inflation strips out volatile items, often food and energy, to reveal underlying price dynamics. Russia’s core at 7.7% in September suggests broad-based pressures beyond temporary shocks.
How Does Inflation Affect the Ruble and Vice Versa?
High inflation can weaken the ruble by eroding real returns, while a weaker ruble raises import prices, creating a feedback loop. Policy credibility and oil prices are key to breaking this cycle and stabilizing the Russian ruble’s inflation outlook.
What Is the Broader Economic Impact, Including on Households and Firms?
Elevated inflation lifts borrowing costs, squeezes real wages, and complicates business planning. Firms face higher input costs and pass-through pressures, while households adjust spending—specifically on food, transport, and utilities.
Does Kremlin Policy Under President Vladimir Putin Influence Inflation?
Fiscal priorities, defense spending, and state-led investment shape demand and the budget stance, which in turn affect inflation pressures and Bank of Russia monetary policy. Policy choices also influence sanctions exposure and supply routes, affecting Russia CPI dynamics.